Kasanvu Portal
MYCU Makerere · Namuwongo Field Study
56 HH · 7 SHOPS · 30 PHOTOS
MYCU Makerere · Namuwongo Field Study
An interactive system built on real Google Forms responses — 56 households, 7 drug shops, 30 GPS-tagged hazard photos in one of Kampala's highest-burden informal settlements.
Every household, drug shop, and hazard photo is plotted within the Kasanvu zone boundary. Click any marker for details. Toggle layers using the controls.
Every figure below is computed live from the actual interviews. No simulation, no estimation.
51 months of DHIS2 records (Jan 2022 – Mar 2026). Confirmed malaria cases by month, year-over-year seasonality, and full timeline.
A representative subset of the field collection. Every image GPS-tagged at the moment of capture.
7 drug shops surveyed. Ranked by partnership readiness — NDA registration, RDT availability, training, referral discipline, stockout management.
Ranked by composite vulnerability — children under 5, pregnant women, environmental exposure, housing quality, current net status.
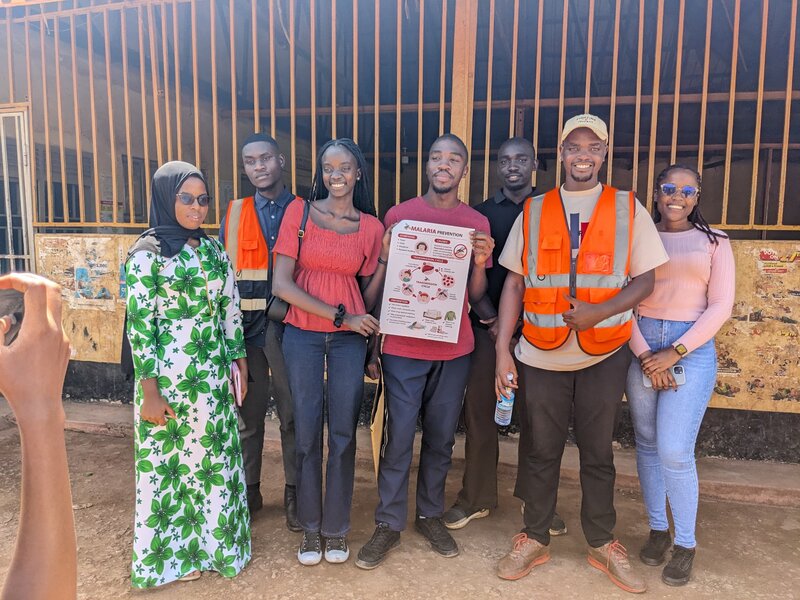
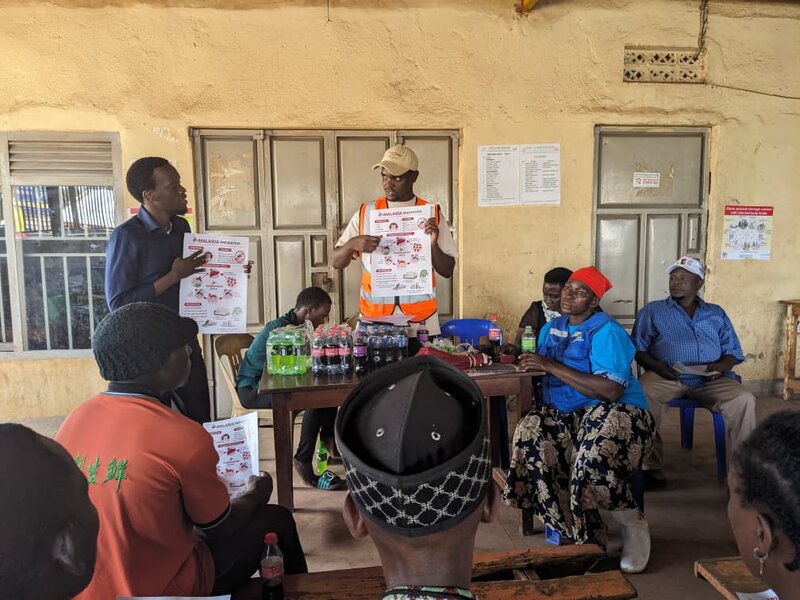
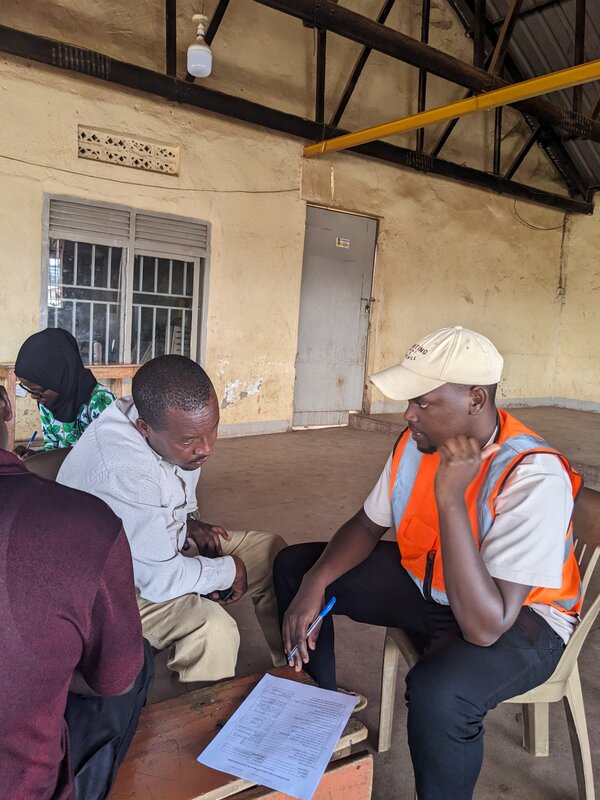
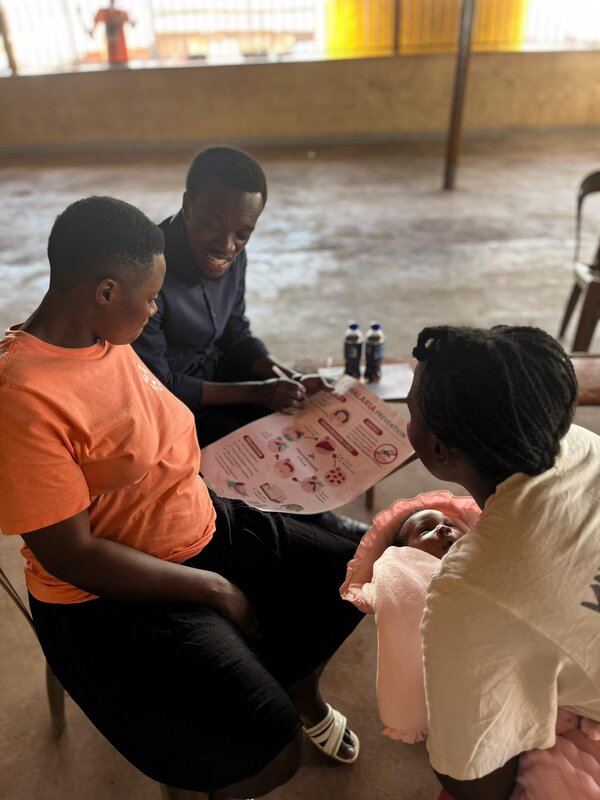
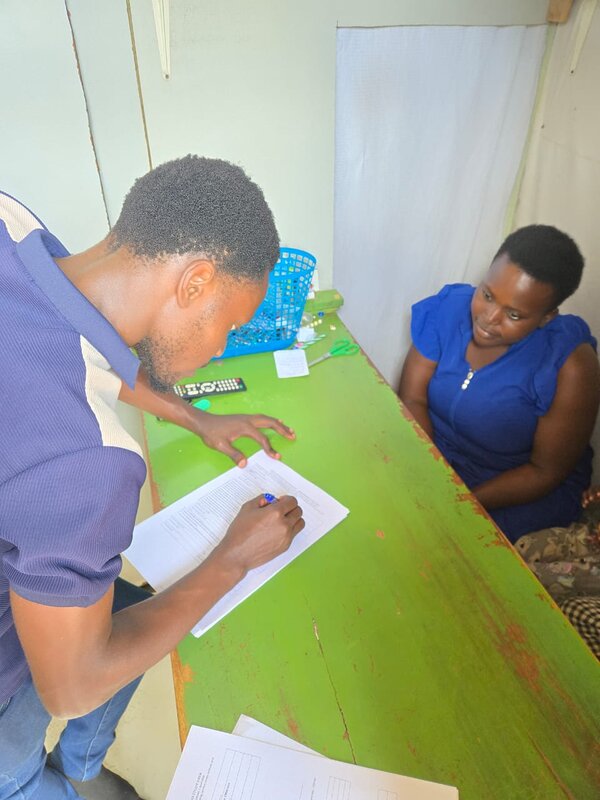
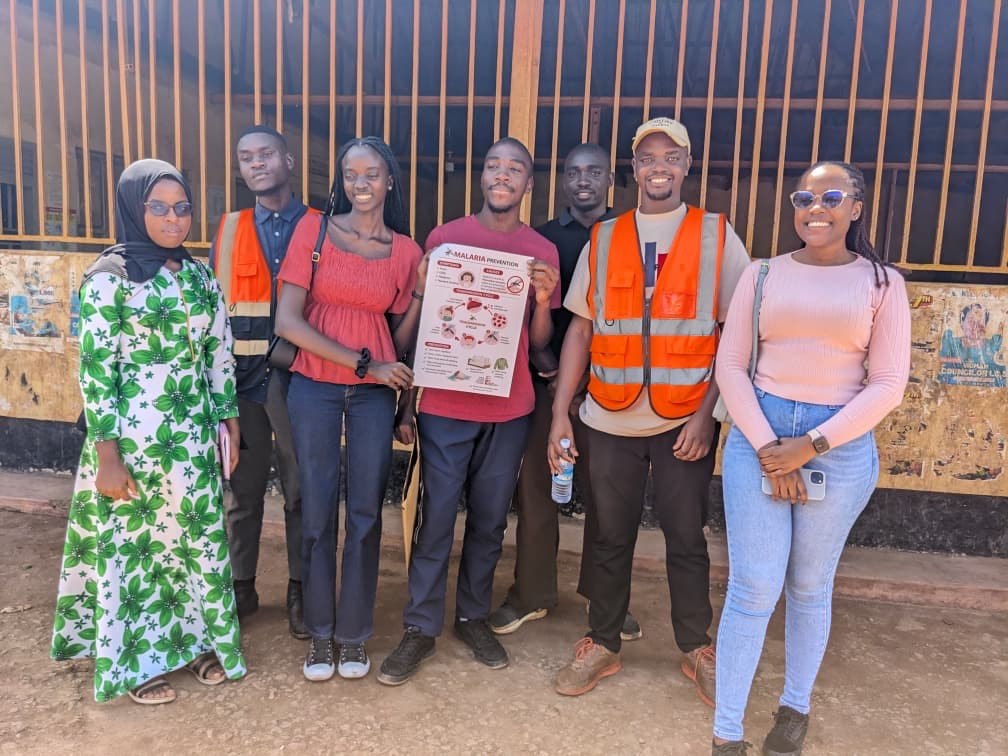
This project was carried out by a team of students from the School of Built Environment, College of Engineering, Design, Art & Technology (CEDAT), Makerere University, in collaboration with consultants from Coventry University, London.
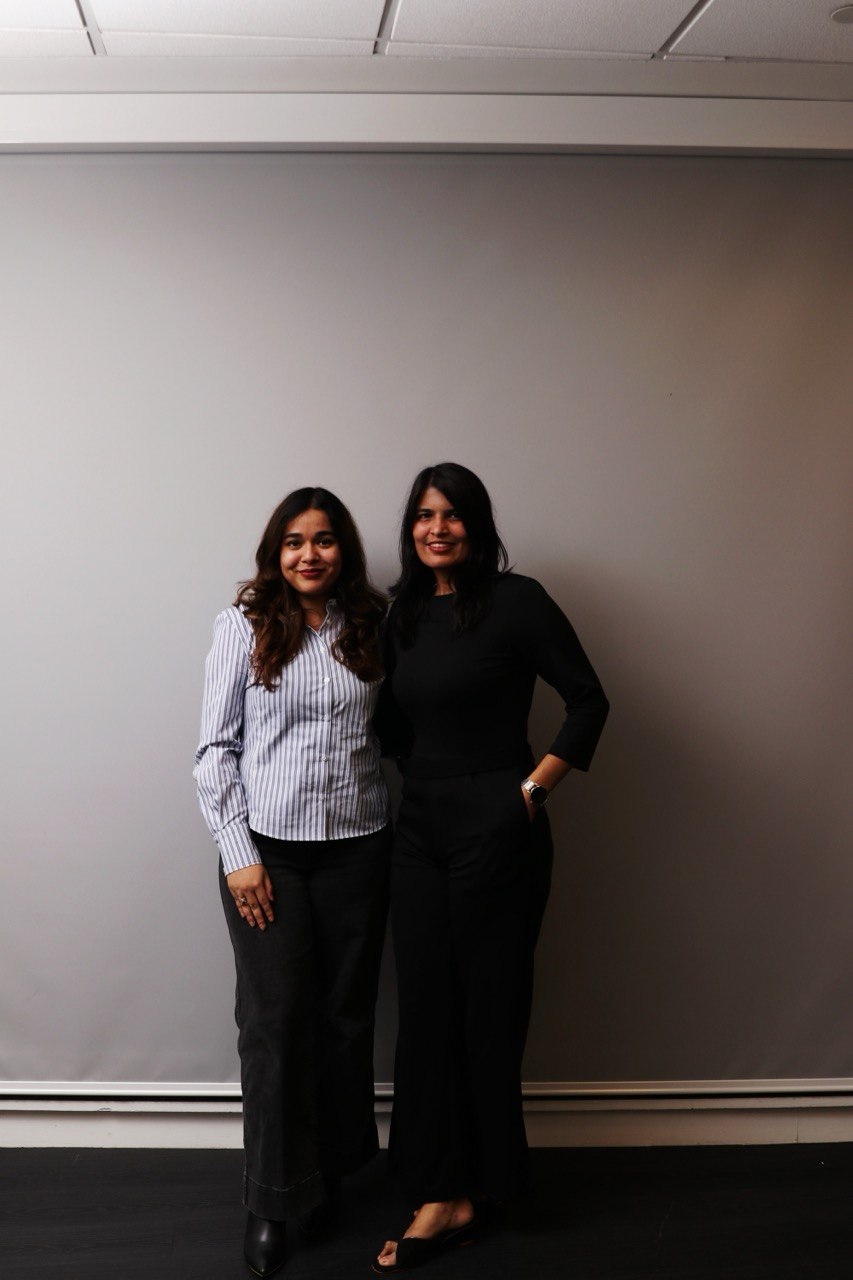
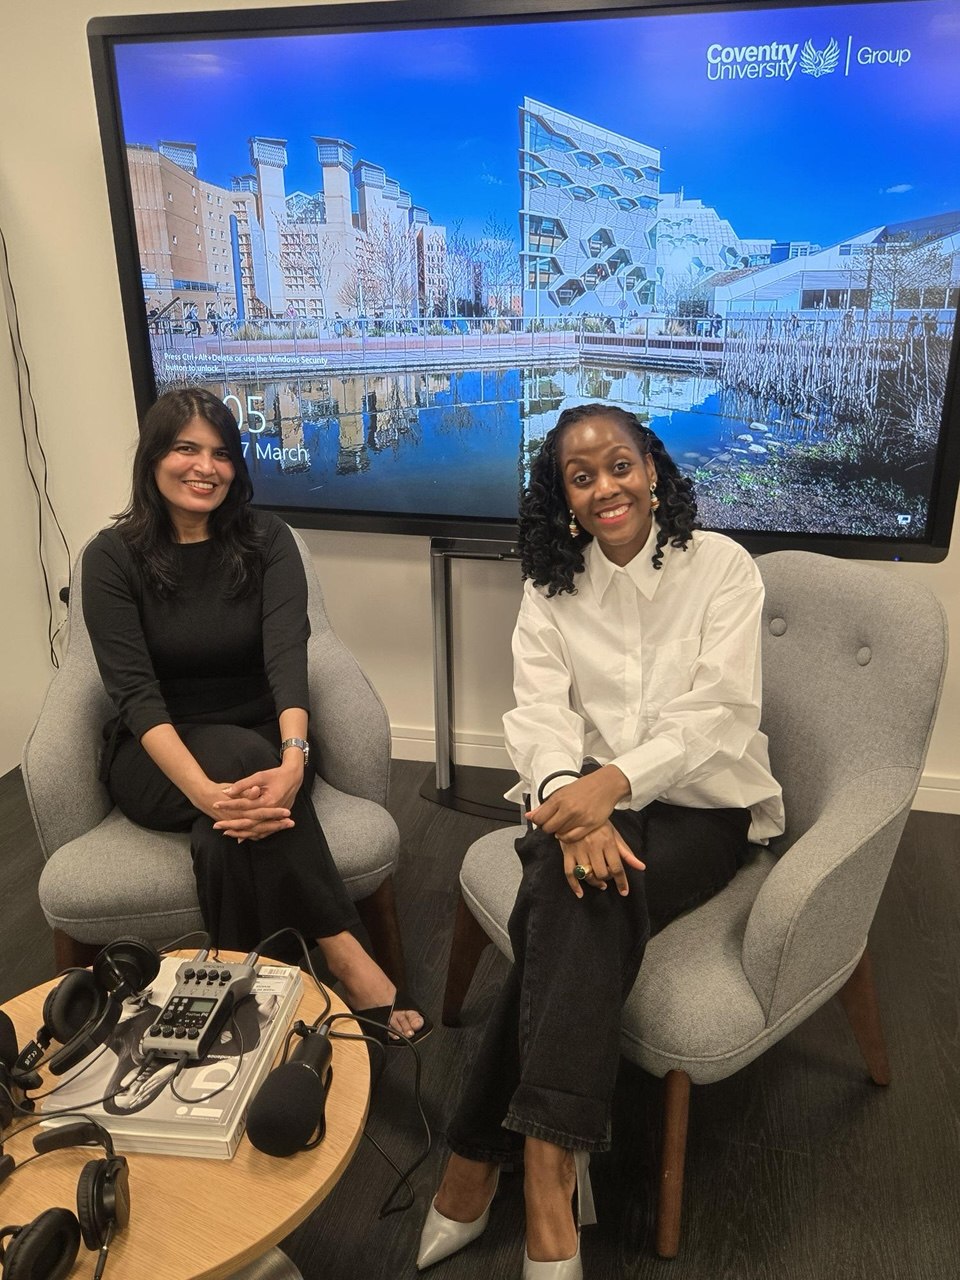
Supervised by Dr. Ivan Bamweyana
Department of Geomatics and Land Management
| Muhumuza Michael | Project Manager |
| Mufumbiro Enock | Technical Officer |
| Kakooza Wycliffe | Technical Officer |
| Turinawe Francis | Technical Officer |
| Nantegje Jennat | Finance & M&E |
| Musiimenta Racheal | Communications |
| Apili Joanne | Human Resources |
| Tumwesige Solomon | Risk & Quality Assurance |
Supervised by Dr. Stella Nalwanga
| Aditi Parakh | Consultant |
| Banshita Sahu | Consultant |
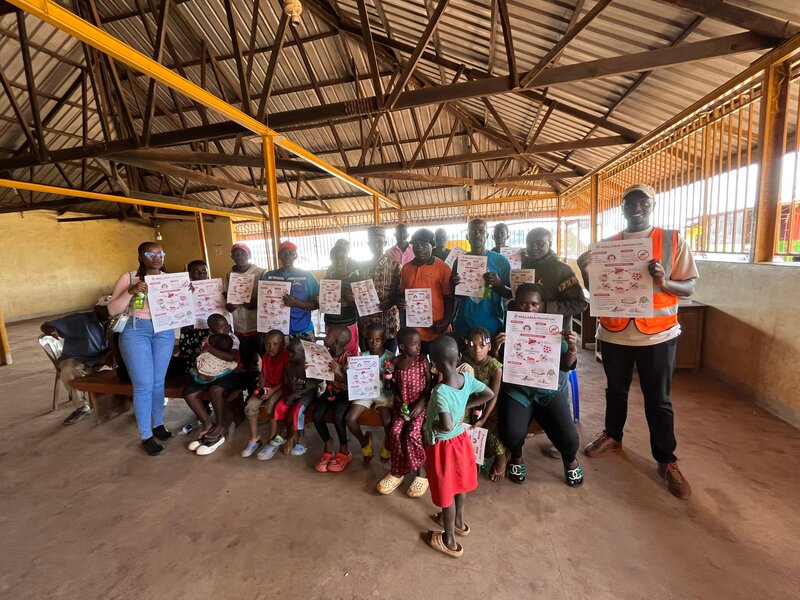
This field study was carried out in partnership with Malaria Youth Champions Uganda as the project client, and with the active participation of the Makerere MYCU Club during field activities and community outreach.
Special thanks to the residents of Kasanvu, the LC1 community leadership, Village Health Teams, and the staff of Kisugu Health Centre III for their cooperation and support throughout the study.
Every contribution moves us closer to malaria-free communities. Make a pledge or give directly via mobile money.
Make a donation →